Growth of capitalization of public and private companies in Russia. Top offers of leading Russian banks
In February 2017, the RIA Rating agency released another top 100 most expensive Russian companies . Their total capitalization in 2016 amounted to $635 billion, which is 58% ($233 billion) higher than in 2015. At the same time, the value of all Russian companies in the top 100 corresponds to the capitalization of Apple alone ($630 billion). However, the potential of many companies is not fully disclosed and their shares on the market may still soar in price.
Top 10 most valuable public companies in Russia in 2017
10. VTB Bank
Capitalization - 15 827 million dollars.
The main shareholders of this bank are state structures - the Federal Property Management Agency and the Ministry of Finance of the Russian Federation. They own 60.9% of voting shares. To size authorized capital VTB Bank ranks first among the country's credit institutions, and second in terms of assets. In 2016, VTB Bank and Russian Post entered into an agreement to establish Post Bank. Dmitry Rudenko became its head, who intends to increase the bank's loan portfolio to 4 billion rubles by 2023.
9. Gazprom Neft
Capitalization - 16 888 million dollars.
 The company was founded in 1995 by order of B. Yeltsin and was then called the Siberian Oil Company. In 2005, its controlling stake was bought out by Gazprom. Gazprom Neft was the first company to start producing oil on the Russian Arctic shelf. By 2020, the company plans to increase the total oil production to 100 million tons of oil equivalent per year.
8. Magnet
Capitalization - 17,005 million dollars.
 Almost all Russian cities are covered by a "magnetic" network. The total number of Magnit stores as of July 2016 reached 12.9 thousand. The first of the "Magnets" was opened in 1998 in Krasnodar and was originally sold there household chemicals. And the development of the hypermarket chain began in 2006. In 2007, the first of them was also opened in Krasnodar. Apparently, this is a happy city for the owners of Magnit.
7. Surgutneftegaz
Capitalization - 18 217 million dollars.
 Most large enterprise the city of Surgut and one of the largest players in the Russian oil market. For the whole of 2016, Surgutneftegaz produced 61 million 848.6 thousand tons of oil and produced 9 billion 663 million cubic meters of gas. And the NPF under the brand of the same name has become one of the most profitable in.
6. MMC Norilsk Nickel
Capitalization - 26 201 million dollars.
 A Russian mining and metallurgical giant that produces 100% platinum in the Russian market, 96% nickel, 95% cobalt and 55% copper. The MMC accounts for 1.9% of Russia's GDP. Vladimir Potanin, who holds the position of General Director of Norilsk Nickel, at a meeting with Vladimir Putin said that by 2023 he intends to invest about 1 trillion rubles in the development of production. This will allow the enterprise to rejuvenate its capacities and make them the largest in the world.
5. NOVATEK
Capitalization - 39 220 million dollars.
 It ranks second in Russia in terms of gas production. Together with such companies as Rosneft, Gazprombank and Vnesheconombank, it is included in the US sanctions list. This means that NOVATEK cannot borrow on the US market for more than three months.
4. LUKOIL
Capitalization - 48,076 million dollars.
 Until 2007, LUKOIL was the leader in terms of oil production in Russia, but then lost this title to Rosneft. In 2017, the company produced its first millionth ton of oil in the Caspian Sea, at the Yu. V. Filanovsky. And in 2016, LUKOIL ranked fourth in the annual environmental performance rating of Russian oil and gas companies according to the World Fund wildlife and 2nd place in .
3. Gazprom
Capitalization - 59 932 million dollars.
 The corporation whose dreams come true ranks third on the list of the most expensive companies RF in 2017. Her interests include not only exploration and production of gas, but also its transportation, storage and sale. Since December 2013, Gazprom has retained the right to export pipeline gas; until that time, the corporation had the right to export from Russian Federation any gas.
2. Sberbank
Capitalization - 61 159 million dollars.
 According to the Central Bank, Sberbank -. There is no need to worry about the deposits placed there, the Central Bank is unlikely to revoke the license from Sberbank in the foreseeable future. And in terms of accessibility, Sberbank occupies the highest step on the banking pedestal - it has almost 17.5 thousand branches and 14 territorial banks in 83 regions of Russia.
1. NK "Rosneft"
Capitalization - 69 907 million dollars.
 A controlling stake in Rosneft is owned by Rosneftegaz, and executive director corporation is Igor Sechin. In 2016, the Glencore consortium and the Qatar Investment Authority fund in Qatar acquired a 19.5% stake in Rosneft for 10.2 billion euros. However, Rosneft still has 50% + 1 share. Last year, Rosneft was mentioned in the press in connection with the high-profile arrest of the head of the Ministry of Economic Development, Alexei Ulyukaev. He is suspected of threatening and extorting a bribe in the amount of two million dollars from a Rosneft representative. Ulyukaev estimated this amount as a positive assessment, which allows Rosneft to acquire the state-owned stake in Bashneft.
The study presents data on the dynamics of the cryptocurrency market and the ICO market in 2017.
1. General analysis of the market of cryptocurrencies and assets (per quarter, year). Market dynamics in 2017
1.1. General analysis of the cryptocurrency and asset market
Tab. 1.1. Quarterly dynamics of the crypto market and top 10 cryptocurrencies by capitalization from 01/01/2017 to 01/01/2018
Over the past 2017, the total market capitalization of cryptocurrencies (Total Market Capitalization) increased by almost 600 billion US dollars, from 17.7 to 612.9 billion US dollars, i.e. 34.6 times (as of January 01, 2018 00:00 UTC; see Table 1.1). On fig. 1 shows the evolution of the crypto market in 2017.
The most intensive growth in the capitalization of the crypto market was in November-December 2017, and on December 21, the capitalization exceeded 650 billion US dollars, followed by a slight correction. The overall increase was mainly due to an increase in the capitalization of Bitcoin by about $220 billion, from $15.5 to $236.7 billion, in addition, the capitalization of altcoins increased by $374 billion, from $2.2 to $376.2 billion. US dollars. At the same time, the total number of types of cryptocurrencies and crypto assets on the exchange increased from 617 to 1,335 units over the year (according to coinmarketcap.com), i.e. more than 2 times. Due to the appearance a large number of competing altcoins, the share of the main cryptocurrency, Bitcoin, in the market decreased quite significantly over the year - from 87.5% to 38.6%. On fig. 2 and 3 show the structure of the crypto market in terms of capitalization (USDbillion) and dominance (%) at the beginning of 2017 and 2018.
The structure of the crypto market changed intensively during 2017, although Bitcoin has always been the leader in terms of capitalization. The second, third and fourth places were most often occupied by the main altcoins: Ethereum, Ripple and Bitcoin Cash, which appeared as a result of the Bitcoin hard fork on August 1. Thus, the share of the Ethereum cryptocurrency, which was 3.9% at the beginning of 2017, reached 27.3 by July 1 %, but decreased to 11.9% by the end of the year, as a result of which Ripple took the second place in terms of capitalization, the rate of which increased significantly in 2017 (Fig. 6).
In turn, the Bitcoin exchange rate in 2017 increased by more than 14 times, from $964 to $14,112. 4 shows the dynamics of this growth.
On fig. Figure 4 shows how actively the crypto market reacted to the news about the start of trading in Bitcoin futures on the Cboe Global Markets (December 10, 2017) and CME Group (December 18, 2017) exchanges. Immediately before the start of trading in Cboe futures, the Bitcoin exchange rate exceeded several thresholds at once. In just two weeks (from November 26 to December 08, 2017), it doubled, from $9,000 to $18,000. However, in the next two days there was a correction, and by the beginning of trading on Cboe (12/10/2017), the rate fell up to $13,300 - 15,500.
Similarly, prior to the start of trading in futures on the world's largest commodity exchange CME Group, the price of Bitcoin recovered in a week and exceeded $20,000 (12/17/2017), but just a day before the start of trading, by 12/18/2017, there was again a small correction to $18,500-19,000. After the launch of CME Group trading in Bitcoin futures, its rate fell even to $12,000 in four days (December 22, 2017), but gradually recovered and until the end of December, BTC traded in the range from $12,300 to $16 800.
It can be assumed that immediately before the start of trading in Bitcoin futures (one or two weeks in advance), a sufficiently large amount of cryptocurrency was purchased to ensure that its exchange rate could be adjusted in the future. Obviously, the fact that Bitcoin is recognized as a valuable financial asset and the emergence of futures had a positive impact on the crypto market in general and attracted additional attention to this currency, and, consequently, caused additional demand for it.
The above data indicates the high liquidity of the crypto market and the readiness of traders to extract additional profits due to short-term changes in rates. At the same time, there are many individual traders and few large institutional players on the crypto market. However, if such players arrive, the crypto market economy may undergo significant changes associated with the emergence of new risk hedging mechanisms (futures contracts), the emergence of high-frequency robots that make transactions in microseconds based on developed trading algorithms, and an increase in the influence of financial funds. As you know, Goldman Sachs, one of the largest financial and investment companies, already helps its clients to buy and sell Bitcoin futures contracts. In the future, the number of financial derivatives on the crypto market will increase, which will attract large funds and require the introduction of clearer rules for its regulation.
To analyze the activity of trading on crypto exchanges in 2017, the quarterly dynamics of the rates of cryptocurrencies included in the top 10 in terms of capitalization is presented below (Fig. 5).
On fig. 5 shows that the fourth quarter of 2017 was the most successful for the crypto market and significantly influenced the rates of the main cryptocurrencies. Especially noticeable in the period from October 1, 2017 to January 1, 2018, the rate of the following cryptocurrencies increased:
- Cardano - from $0.022 to $0.72 (more than 32 times)
- Stellar - from $0.0135 to $0.36 (more than 25 times)
- Ripple - from $0.198 to $2.30 (more than 10 times)
In table. Table 1.2 shows the results of calculations of the quarterly dynamics of the crypto market and the top 10 cryptocurrencies by capitalization from 01/01/2017 to 01/01/2018 in percent. The values in USD from Table 1 are taken as a basis. 1.1.
Tab. 1.2. Quarterly dynamics of the crypto market and top 10 cryptocurrencies by capitalization from 01/01/2017 to 01/01/2018 (in %)
Many media outlets have repeatedly called 2017 the year of cryptocurrencies. And, indeed, the growth of the rates of the top 10 cryptocurrencies by capitalization in 2017 was truly a record (see Fig. 6). For example, the Ripple rate increased by 35 160% over the year, from $0.006523 to $2.30, i.e. 352.6 times.
The growth of rates for the fourth quarter of 2017 is shown in Fig. 7.
In table. Table 1.3 presents the key events of 2017 that influenced the rate of dominant cryptocurrencies and the crypto market as a whole, indicating the nature and direction of their influence.
Tab. 1.3. Key events that influenced the crypto market in 2017
In table. Table 1.4 presents a list of events, information about which can affect both the rate of individual cryptocurrencies and the market as a whole.
Tab. 1.4. Events that may affect the rate of cryptocurrencies (cryptomarket) in 2018
2. General market analysisICOfor 2017
2.1. Brief market overview (important events for 2017)
- 01/08/2017 – 2016: The Year Blockchain ICOs Disrupted Venture Capital
- 01/24/2017 – Watch Out – The ICOs Are Coming
- 03/01/2017 – CoinDesk Research: Speculation Driving Boom in Blockchain ‘ICOs’
- 03/10/2017 – Investment Firm Blockchain Capital is Launching a $10 Million ICO
- 04/16/2017 – Blockchain Capital Raises $10 Million ICO for VC Startup Fund
- 25.04.2017 –
- 05/06/2017 – Blockchain Asset Fund TaaS Raises $7.7 Million Through ICO
- 18.05.2017 –
- 01.06.2017 –
- 06/29/2017 – Pantera Capital to Raise $100 Million for ICO Fund
- 07/17/2017 – $7 Million Lost in CoinDash ICO Hack
- 07/21/2017 – ICO Mania: $1.2 Billion Raised in 2017, $600 Million in the Last 30 Days
- 08/04/2017 – Filecoin startup raises $52 million ahead of ICO
- 08/22/2017 – Estonia is preparing to host the world's first public ICO
- 09/08/2017 – Filecoin platform sets a new record for ICO - $257 million
- 09/27/2017 – Kik completes ICO with $98.8 million investment
- 07.10.2017 –
- 10/27/2017 – Billionaire Warren Buffett: Bitcoin is a “real bubble”
- 11/17/2017 – Tezos investors made another attempt to recover funds through the court
- 11/29/2017 – Tokenized Fund-of-Funds to Raise $100 Million Via ICO
- 12/04/2017 – SEC Accuses PlexCoin ICO Organizers of Fraud
- 12/22/2017 – Belarus legalizes mining and operations with cryptocurrencies
2.2. Aggregated indicators of the dynamics and efficiency of the market of past (ended, fromcompleted) ICO
To assess the dynamics and efficiency of the market of successfully completed and/or listed ICOs, a set of tools is offered (see Table 2.1).
Tab. 2.1. Tools for evaluating the effectiveness of the market successfully completed and / or entered the exchangeICO
Tab. 2.2. Aggregated indicators of the dynamics and efficiency of the market of past (ended,Completed) ICOin 2017
The data from the beginning of 2017 has been adjusted to reflect the emergence of more complete information on past ICOs. As a result, the total amount of funds raised in 2017 amounted to more than 6 billion US dollars (taking into account the amount of funds raised through 382 ICOs). During the fourth quarter of 2017, ICO collections exceeded $3.1 billion. This amount is made up of the results of the 196 most successful completed ICOs, with the largest amount raised approximately $258 million (ICO Hdac). The average amount of funds raised per project is $16 million. More detailed data on the main ICOs of the past year are presented in Table. 2.3.
2.3. Quantitative analysis of the ICO market
1. The amount of funds raised and the number of ICOs
Tab. 2.3.The amount of funds raised and the number of ICOs
Tab. 2.3 shows that the largest amount of ICO funds was raised in June and December 2017.
2. Quarterly analysis of the top ICOs of 2017
Tab. 2.4.Top 10 ICOs by Funds Raised, Q1 2017
In table. 2.4 shows the top 10 ICOs successfully completed in the first quarter of 2017.
At the moment, according to the Token Performance indicator, all projects from the top 10 have values from 0.73x to 101.85x. One of the most successful ICOs in terms of the amount of funds raised was the ChronoBank project, and in terms of the process of entering the stock exchange, the Augmentors project, because. it is this project that has the Current Token Price to Token Sale Price ratio of 101.85x. When considering this indicator, one should take into account the completion date of the Augmentors ICO (February 2017), i.e. growth of 101.85 times occurred in about 10 months.
On fig. Table 2.2 shows the top ten ICOs completed from January to March 2017.
Tab. 2.5.Top 10 ICOs by Funds Raised, Q2 2017
In table. Table 2.5 shows the top 10 ICOs successfully completed in the second quarter of 2017.
The EOS project turned out to be the leader in terms of funds raised. Highest value in terms of "Efficiency" (Token Performance), i.е. the best ratio of Current Token Price to Token Sale Price is 16.25x and belongs to ICO Status. Its market capitalization is this moment is about 2 billion US dollars.
On fig. Table 2.3 shows the top ten ICOs completed from April to June 2017.
Tab. 2.6.Top 10 ICOs by Funds Raised, Q3 2017
In table. Table 2.6 shows the top 10 ICOs successfully completed in the third quarter of 2017.
The Filecoin project turned out to be the leader in terms of funds raised. the best ratio of Current Token Price to Token Sale Price is 62.14x and belongs to ICO ICON. Its market capitalization is currently around $2.7 billion.
On fig. 2.4 shows the top ten ICOs completed from July to September 2017.
Tab. 2.7.Top 10 ICOs by Funds Raised, Q4 2017
In table. 2.7 shows the top 10 ICOs successfully completed in the fourth quarter of 2017.
The Hdac project turned out to be the leader in terms of the amount of funds raised and the most successful throughout the ICO. It raised $1 million more than the Filecoin project mentioned above, which until now held the top spot in terms of fees.
Hdac is an acronym for Hyundai Digital Asset Currency. This is a hybrid project that creates a giant, constantly evolving information platform based on the blockchain and the Internet of Things (IoT). This project offers an ecosystem with public (Public) and private (Private) keys to interact with the devices around you, the number of which will constantly grow (smart home, smart car, smartphone, smart watch, TV, refrigerator, stove, kettle, etc. .). The Hdac configuration creates a reliable, confidential, consistent and controlled communication system that will allow you to carry out fast transactions, increase the convenience of all types of payments: taxes, settlements with clients, investments, loans, etc.
On fig. Table 2.5 shows the top ten ICOs completed from November to December 2017.
3. TopICOsince the beginning of 2017
In table. Table 2.8 shows the top 10 largest ICOs in terms of funds raised in 2017, most of which fall into the Infrastructure category.
Tab. 2.8.Top 10 ICOs in terms of funds raised in 2017
Over the past 2017, 382 projects successfully completed ICOs, each of which raised more than 100 thousand US dollars, while the total amount of funds raised was at least 6 billion US dollars. The leader of the year was the Hdac project ($258 million).
Glossary
| Key Concepts | Definition |
| Initial coins offering, ICO(initial coin offering, initial coin offering) | A form of collective support for innovative technology projects, a kind of pre-sale and attraction of new supporters through an initial coin offering to future holders in the form of blockchain-based cryptocurrencies (tokens) and crypto-assets. |
| market capitalization (Rmarket cap) | The cost of the object, calculated on the basis of the current market (exchange) price. This financial indicator is used to assess the total value of market instruments, entities and markets. [Wikipedia]. |
| Cryptocurrency market capitalization | The total market value of cryptocurrencies circulating on the market. |
| Total cryptocurrency market capitalization | Market capitalization of cryptocurrencies and assets, i.e. the total market value of cryptocurrencies and assets circulating on the market. |
| token reward | Efficiency of the token (current price of the token / price of the token at the time of the ICO), i.e. reward for one US dollar invested in the token. |
| dominance | Market share, i.e. the ratio of cryptocurrency (token) capitalization to the total market capitalization. Expressed as a percentage. |
| token sale price
current token price |
The price of the token at the time of the ICO. The current price of the token. |
| Not Mineable | The coin is not mined (from the English mining). It is used in relation to cryptocurrencies (tokens) that do not have a mining function or are not issued during the mining process. |
| Premined | Pre-mining coin. It is used in relation to cryptocurrencies (tokens) that are issued during the mining process, but a certain number of coins (tokens) were created and distributed to certain users when the project was launched. |
| The rate of market increase (in % to the beginning of the year) | Market growth rate (in % to the beginning of the year), i.e. by what % the market capitalization has increased in relation to the beginning of the year. |
| The growth rate of the market (in % to the beginning of the year) | Market growth rates (in % to the beginning of the year), i.e. how many times has the market capitalization changed in relation to the beginning of the year. |
| Increase in market capitalization (in USD million compared to previous period) | Growth in the market capitalization of cryptocurrencies and assets (in million US dollars compared to the previous period), i.e. by how many million US dollars has the market capitalization changed over the period. |
| The rate of market increase (in % compared to previous period) | Market growth rate (in % of the previous period), i.e. By what percentage has the market capitalization increased over the period? |
| The market growth rate (in %compared to previous period) | Market growth rates (in % to the previous period), i.e. How many times has the market capitalization increased in relation to the previous period. |
| Number of cryptocurrencies and digital assets | The number of cryptocurrencies and assets. At the time of the formation of the glossary, more than 1070 types of cryptocurrencies and assets were circulating on the market. |
| Average market capitalization | Average market capitalization, i.e. the ratio of the market capitalization of all cryptocurrencies and assets to their number. |
| Tokenreturn | An indicator of the effectiveness of funds spent on the purchase of tokens, or the ratio of the current price of the token and the sale price of the token, i.e. the effectiveness of investing one US dollar in tokens at the stage of selling tokens, subject to their subsequent sale on a crypto exchange for US dollars. |
| ETH reward – current dollar value of $1 spent on buying tokensduring the token sale | An alternative indicator of the effectiveness of funds spent on the purchase of tokens during the ICO period, or the ratio of the current ETH rate to its rate at the time the sale of ICO tokens began, i.e. if one US dollar was invested not in ICO, but in ETH at its rate at the time the token sale began, and then sold at the current ETH rate. |
| BTC reward– current dollar value of $1 spent on buying tokensduring the token sale | Similar to the previous one: An alternative indicator of the effectiveness of funds spent on the purchase of tokens during the ICO period, if one US dollar was invested in BTC at the rate at the start of the ICO, and then sold at the current BTC rate. |
| Token/ETH reward | The ratio of the economic gain/loss of a market participant in connection with the purchase of tokens at the ICO stage to the possibility of investing in ETH. If the value is > 1, then the market participant has reached greater efficiency investment of funds spent on tokens than if he invested in the ETH cryptocurrency. |
| Token/BTC reward | The ratio of the economic gain/loss of a market participant in connection with the purchase of tokens at the ICO stage to the possibility of investing in BTC. If the value is > 1, then the market participant has achieved a greater efficiency of investing funds spent on tokens than if he had invested in BTC cryptocurrency. |
| ZAK-n Crypto index | The index is calculated as a percentage and represents the ratio of trading volumes (transactions) on the cryptocurrency exchange per day (Volume 24h) by n
dominant cryptocurrencies to the sum of their market capitalization. When calculating the ZAK-4 Crypto index, the four dominant cryptocurrencies with the largest market capitalization are taken into account - Bitcoin, Ethereum, Bitcoin Cash and Ripple. When calculating the ZAK-8 Crypto index, the trading volumes and market capitalization of eight cryptocurrencies are taken into account: Bitcoin, Ethereum, Bitcoin Cash, Ripple, Litecoin, DASH, Cardano and IOTA. |
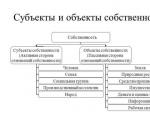
"I cited figures from which one could see that in Russia, mainly state-owned companies, their subsidiaries, as well as numerous budget institutions, which together control 70% of the Russian economy. They are mainly a source of replenishment of the budget of the Russian Federation. Individuals in the Russian Federation form approximately 10% of the budget, while in the US this share is approximately 64%.
Below we will see how the capitalization of the most expensive Russian companies has changed in recent years:
| Company | Share controlled by the state, % | Owners | Change in capitalization in $ per, % | Change in capitalization in $ from 2014 to 2017 , % | Capitalization at the end of 2017, $ million | ||
|---|---|---|---|---|---|---|---|
| 2017 | 2016 | 2015 | |||||
| Sberbank | 50% + 1 share | *Central Bank of the Russian Federation - 50% + 1 share; * other shareholders are more than 8273 legal entities and individuals ( individuals- 2.84%, foreign investors - more than 45%) | 37,9 | 104,1 | 44,9 | 307,83 | 84 311 |
| Gazprom | over 50% | * Federal Property Management Agency - 38.37%; * OJSC Rosneftegaz* -10.97%; * OJSC Rosgazifikatsiya* -0.89%; *ADR holders - 25.20%; *other registered persons -24.57% | -11 | 35,4 | -20 | -3,60 | 53 349 |
| Rosneft | 50% | *JSC Rosneftegaz - 50%, *British BP - 19.75%, *Swiss-Qatari consortium QHG Oil Ventures - 19.5% | -23,7 | 87,7 | 1,2 | 44,93 | 53 304 |
| Lukoil | h | 1,9 | 75,1 | -18,1 | 46,13 | 48 933 | |
| NOVATEK | h | -9,4 | 58,1 | 5,4 | 50,97 | 35 543 | |
| Norilsk Nickel | h | 12,6 | 31,5 | -13,2 | 28,52 | 29 511 | |
| Gazprom Neft | 95.68% Gazprom | *Gazprom - 95.68%; *in free float - 4.32% | 19,4 | 68,9 | -15,8 | 69,80 | 20 165 |
| Tatneft | h* | 18,8 | 58,4 | 6,2 | 99,85 | 17 959 | |
| Surgutneftegaz | h | -5,6 | 8,8 | 10,7 | 13,70 | 17 191 | |
| NLMK | h | 35,8 | 119 | -25,5 | 121,56 | 15 349 | |
| Severstal | h | 1,2 | 82,5 | -5,1 | 75,27 | 12 985 | |
| Yandex | h | 64,7 | 48,7 | -9,5 | 121,64 | 10 669 | |
| RUSAL | h | 62,7 | 41,2 | -54,4 | 4,76 | 10 569 | |
| VTB Bank | 60,90% | * Federal Property Management Agency - 60.9%; *The rest of the shares are distributed among GDR holders and minority shareholders - individuals and legal entities. | -33,1 | 12,4 | -7,4 | -30,37 | 10 595 |
| Pole | h | -25 | 84,5 | 123,9 | 209,82 | 10 482 | |
| Magnet | h | -38,9 | 17,8 | -12,8 | -37,24 | 10 382 | |
| X5 Retail Group | h | 16,4 | 71,2 | 51,6 | 202,10 | 10 256 | |
| ALROSA | 33% | *in free circulation - 34%; * RF - 33%. | -18,3 | 106,7 | -30,3 | 17,71 | 9 584 |
| MTS | h | 13,1 | 41,7 | -5,2 | 51,93 | 9 578 | |
| MMK | h | 34,7 | 115,2 | 35,8 | 293,65 | 8 210 | |
| En+ Group | h | - | 7 771 | ||||
| VEON | h | -1,2 | 17,4 | -21,5 | -8,95 | 6 685 | |
| Mail.ru Group | h | 57,5 | -13,9 | 37,7 | 86,73 | 6 360 | |
| Inter RAO | *PJSC FGC UES - 9.24%; * JSC Inter RAO Capital (quasi-treasury shares) - 29.39%; | *Rosneftegaz Group - 27.63%; *PJSC FGC UES - 9.24%; * JSC Inter RAO Capital (quasi-treasury shares) - 29.39%; *in free circulation - 33.74%. | -7 | 317,8 | n.a. | 6 079 | |
| Uralkali | h | -25,4 | 11,4 | 5,7 | -12,16 | 5 966 | |
| Bashneft | Rosneft | The main shareholder is Rosneft | -33,8 | 117,2 | 24,1 | 78,44 | 5 793 |
| PhosAgro | h | 0,5 | 10,1 | 31,6 | 45,62 | 5 555 | |
| Megaphone | h | -6,9 | -18,7 | -21,5 | -40,58 | 5 503 | |
| EVRAZ | h | 41,4 | 152,8 | -54,8 | 61,57 | 5 470 | |
| RusHydro | 60.6%, VTB Bank (13.3%) | *Rosimushchestvo - 60.6%; *VTB Bank - 13.3%; *LLC "Aviatrans" - 6% | -8,5 | 66 | -2 | 48,85 | 5 373 |
| Polymetal | h | 17,1 | 25,4 | -3,8 | 41,26 | 5 298 | |
| UAC | 90,30% | *Rosimushchestvo - 90.3%; *Vnesheconombank - 5.6%; *private shareholders - 4.1% | 42,6 | 128,1 | 324 | 1279,15 | 4 899 |
| Moscow Exchange | Central Bank of the Russian Federation (11.779%), Sberbank (10.002%), Vnesheconombank (8.404%), RDIF Investment Management-6 (5.003%) | *Central Bank of the Russian Federation - 11.779%; *Sberbank - 10.002%; *Vnesheconombank - 8.404%; *EBRD - 6.069%; * RDIF Investment Management-6 - 5.003%; * in free circulation - 57% | -7,6 | 61,1 | 17,8 | 75,35 | 4 315 |
| PIK Group | h | 13,2 | 62,7 | -10,2 | 65,39 | 3 654 | |
| FGC UES | 80.13% Rosseti | *PJSC Rosseti - 80.13%; *Rosimuschestvo-0.59%; *minority shareholders -19.28% | -15,4 | 313,4 | 3 | 260,23 | 3 591 |
| Tinkoff Bank | h | 78,7 | 245,9 | -4,4 | 490,93 | 3 443 | |
| VSMPO-Avisma Corporation | h | 29,5 | 33,7 | 14 | 97,38 | 3 375 | |
| NK "Russneft" | h | 15 | - | 3 118 | |||
| Rostelecom | Previously: 48.71%, Vnesheconombank (4.29%) | *Rosimushchestvo - 45.04%; *Vnesheconombank - 3.96%; *Mobitel LLC (subsidiary of Rostelecom) - 12.01% | -20,2 | 10,4 | -20,6 | -30,05 | 2 840 |
| "Rosseti" | 88,89% | * Federal Property Management Agency - 88.89% | -23,1 | 261,7 | -15,8 | 134,20 | 2 839 |
| RIBBON | h | -29 | 21,5 | 12,9 | -2,61 | 2 835 | |
| Unipro | h | -6,8 | - | 9,5 | 2 795 | ||
| Akron Group | h | 14,7 | 14,3 | 56,4 | 105,04 | 2 733 | |
| "Aeroflot - Russian Airlines" | 61,17% | *Rosimushchestvo - 61.17%; *legal entities(including from the subsidiary OOO Aeroflot-Finance - 5.13158%) - 34.04%; *individuals - 4.79%; *in free float (ticker AFLT on the Moscow Exchange) - part of the shares. | -4,3 | 227,6 | 36,1 | 326,69 | 2 681 |
| Novorossiysk Marine trade port | Previously: 50.1% stake - Novoport Holding Ltd. (JV Transneft and Summa Group), 20% owned by the Federal Property Management Agency | *PJSC Transneft - 62%; *Rosimushchestvo-20%; * structures of Russian Railways - 5%; *free circulation on the Moscow and London stock exchanges-13% | 26,7 | 112 | 155,3 | 585,75 | 2 642 |
| state | -6,17 | 134,67 | 29,31 | 207,18 | 255 819 | ||
| private | 13,62 | 54,47 | 5,24 | 85,09 | 310 407 | ||
| public-private | 0,27 | 93,27 | 47,60 | 226,27 | 16 541 | ||
*h-private company
I included ALROSA, the Moscow Exchange, the Novorossiysk Commercial Sea Port as public-private companies.
As can be seen from the table, from 2014 to 2017 capitalization state companies in $ increased by an average of 207.18%, and private by 85.09%.
1. KLA - 1279.15%
2. Novorossiysk Commercial Seaport - 585.75%
3. Tinkoff Bank - 490.93%
4. "Aeroflot - Russian Airlines" - 326.69%
5. Sberbank - 307.83%
6. MMK - 293.65%
7. FGC UES - 260.23%
8. Pole - 209.82%
9. X5 Retail Group - 202.10%
10. Rosseti - 134.20%
11. Yandex - 121.64%
12. NLMK - 121.56%
13. Akron Group - 105.04%
14. Tatneft - 99.85%
15. VSMPO-Avisma Corporation - 97.38%
16. Mail.ru Group - 86.73%
17. Bashneft - 78.44%
18. Moscow Exchange - 75.35%
19. Severstal - 75.27%
20. Gazprom Neft - 69.80%
21. PIK Group - 65.39%
22. EVRAZ - 61.57%
23. MTS - 51.93%
24. NOVATEK - 50.97%
25. RusHydro - 48.85%
26. Lukoil - 46.13%
27. PhosAgro - 45.62%
28. Rosneft - 44.93%
29. Polymetal 41.26%
30. Norilsk Nickel - 28.52%
31. ALROSA - 17.71%
32. Surgutneftegaz - 13.70%
33. RUSAL - 4.76%
UAC became the fastest growing company. Apparently this was facilitated by the introduction of advanced technologies industrial production. For example, the United Aircraft Corporation (UAC) has implemented the concept of a virtual design bureau, when engineers from several design bureaus and production sites work on designing an aircraft model in a single digital environment.
The Russian concern displaced the American corporation ExxonMobil, which headed this rating for 12 years. In addition to "Gazprom" in the top 10 S&P rating got another Russian company - (6th place). became 14th, Rosneft was put in 22nd place.
On the websites and almost simultaneously, materials with headings were published: “What are the sanctions? Gazprom ousted ExxonMobil. The author of the note in Forbes notes that the first place of the Russian gas concern testifies to the ability of its management to withstand low prices for hydrocarbons and the ban on obtaining cheap loans in the West, and at the same time maintain a leading position in the European gas market, where American companies have so far unsuccessfully tried to gain a foothold. .
Recall that the United States recently passed a law on new sanctions against Russia. The term for financing Russian energy companies will be reduced from 90 to 60 days. Maximum term funding for Russian banks subject to sanctions will be reduced from 30 to 14 days.
A separate line was announced on opposition to the construction of the Nord Stream-2 gas pipeline, which is being carried out by Gazprom.
At the end of September, he announced November 28 as the date for the introduction of new restrictions on the financing of banks and companies in the Russian oil and gas sector, specified in this law.
But there is one significant detail that overshadows the joy of the success of the "national treasure", which is unaffected by sanctions. Gazprom is a cheap asset. Evgeny Koryukhin, an analyst at Alor Broker, compared the capitalization of companies from the top ten in the S&P Global Platts rating for Gazeta.Ru.
In this top ten, Gazprom occupies only 5th place in terms of capitalization. Moreover, the ExxonMobil corporation costs almost 7 times more than Gazprom, and occupies only 9th place in the rating.
The French company closes the top ten, but its capitalization exceeds Gazprom's by 2.6 times, the Chinese China Petroleum is 2 times more expensive, and the Indian Reliance Industries is 1.5 times more expensive.
Yevgeny Koryukhin notes that Gazprom's proven gas reserves are worth more than $10 trillion (with an average gas price of $200 per 1,000 cubic meters). For comparison, the proven hydrocarbon reserves of Exxon Mobil (the world's largest oil company) are estimated at just over $1.2 trillion (with an average oil price of $50 per barrel).
“Russian companies have been valued lower than their counterparts from developed countries for a long time. Even at the household level, we are used to what it costs like eighteen Gazproms. But at the same time, Gazprom's EBITDA is only 1.5 times lower. Compare - it costs 18 times cheaper, and EBITDA is only 1.5 times lower, ”
says Deputy CEO development retail business IC "Veles Capital".
It is worth emphasizing that, of course, not only Gazprom is underestimated, but also domestic companies from other sectors.
If we talk about the Russian market, then according to many fundamental and technical factors, it looks underestimated, the Alfa Capital analyst agrees.
“If we compare the dynamics of Russian stock indices with developed and developing countries, then Russian ones are largely lagging behind. But there are practically no prerequisites for this, since unemployment in Russia is one of the lowest in the world, GDP growth is more than 2%, and, importantly, company profits are growing,” he notes.
However, if you look at financial indicators"Gazprom" and compare them with the performance of competitors, then "Gazprom" obviously wins. The Russian company has a high dividend yield of 6.5%, with an average dividend yield of foreign analogues at 3.5%. If we talk about the P/E multiplier (price/earnings ratio - capitalization/net profit), then Gazprom has one of the lowest, 3.9, which indicates a strong underestimation market value company relative to current earnings.
For example, this figure is 30 for Exxon, 29 for Exxon, and even 22 for capital. The return on capital is significantly higher than foreign counterparts and is about 5.9% against the industry average of 3%. The same can be said about the return on invested capital.
At the same time, Evgeny Koryukhin recalls that before the global financial crisis, in June 2008, Gazprom was worth $360 billion. And its capitalization lagged behind the capitalization of Exxon Mobil not so much - the gap was only about $50 billion. At that moment, the company's management predicted the growth of its capitalization to $1 trillion.
These plans were never destined to come true - oil and gas prices fell, bubbles in the financial markets collapsed, speculative money left Russian assets. And they never returned.
Today, analysts say that underestimation Russian market is chronic and it is unlikely that the situation will be able to change much in the near future. There are several reasons for this. This and poor working conditions for foreign investors, underdeveloped financial market, the relatively low efficiency of the operating activities of the companies themselves, as well as the instability course national currency.
"Investors are scared away total control state behind the industry, economic sanctions, far from always obvious investment policy of companies and quality corporate governance", - says Artem Kopylov.
But, perhaps, the main factor is political problems. The confrontation with the West leaves practically no chance that Gazprom or anyone else has become a leader in terms of capitalization.
“I think that Western investors should become more inclined to buy our shares if the political situation improves significantly,” says Alexei Bushuev.
In order for investors to massively buy securities of Russian companies, it is necessary that they believe that there will be no devaluation of the local currency, that Russia will not get involved in geopolitical conflicts in other countries, thereby incurring a wave of sanctions, that the government will be able to create conditions under which the economy will reach GDP growth rates above 3% per year, Evgeny Koryukhin lists.
Russian companies need to improve their operating and investment efficiency, analysts say. Quotes can support programs for companies to buy back their own shares, increase dividends, as well as a stable ruble exchange rate.
The chief analyst believes that a 20-25% increase in Gazprom's shares is quite possible. Firstly, due to the fact that the shares remain fundamentally undervalued, and secondly, due to the expected increase in selling export prices in the European direction this autumn and an increase in purchase volumes.
But globally, for Russian assets, the situation is unlikely to change in the near future, sums up Alexei Bushuev.
Moscow, January 31 - “Vesti. Economy". The total market capitalization of the 100 most expensive Russian public companies at the end of 2017 increased by 1.3%, to 643 billion dollars.
Below we present the ten most expensive Russian companies.
The leading position in the rating is now occupied by Sberbank, whose capitalization over the past year has grown by almost 40%, to $84 billion. The share of market capitalization attributable to financial sector companies rose to 16.9% over the year from 15.8% in the previous ranking, and their market value approached $110 billion.
The long-term leader, Gazprom, with a capitalization of $53.35 billion, occupied the second line following the results of the past year. Capitalization of "Gazprom" was reduced by 11%, but it still allowed him to slightly (by only 45 million dollars) overtake "Rosneft".
3. Rosneft
Rosneft, which in 2016 pushed off the pedestal of the long-term leader - Gazprom, could not hold on to the first place in 2017 and, according to the results of the past year, took third place. This is due to a decrease in the capitalization of Rosneft by 24% per year, to $53.3 billion.
Among the 100 most valuable companies, market capitalization in 2017 increased for 55, which is significantly less than last year's result (91 companies). In general, in five companies, capitalization growth in 2017 was multiple, which in most cases was due to additional issues. For comparison, in 2016, 25 companies showed a multiple increase in capitalization, which was most often determined by the dynamics of shares.
The minimum amount of market capitalization required to get into the top 10, on the contrary, became less over the year - $15.3 billion against $15.9 billion a year earlier.
According to RIA Rating experts, in 2018, the growth of quotations for most companies, which began in mid-2017, is likely to continue. At the same time, for many of them, the effect of a low base has already been exhausted and growth should not be very strong.
As before, the largest contribution to the total value of the most valuable companies in 2017 was made by corporations associated with oil and gas production and oil refining. They account for 39.9% of the total capitalization of the Top 100 most expensive companies in Russia, which is 4.2 percentage points less than a year earlier. The reduction in the share is associated with the negative dynamics of the cost of a number of largest companies from this sector.
Left the top ten largest companies in Russia by capitalization retailer "Magnit" and VTB. VTB moved from tenth place in 2016 to 14th place at the beginning of 2018, due to a 33% reduction in capitalization. At retail network Over the past year, Magnit's capitalization has declined even more - by 39%, or by $6.6 billion, which led to the loss of eight places in the ranking, and now this company is in 16th place.
Metallurgy became the third industry in terms of total capitalization. Metallurgical companies account for 13.9% of the market value of the largest Russian companies by capitalization. In general, 2017 can be called the “year of metallurgists”, since, following the prices of steel and coal, their stock quotes showed a rapid positive trend.