Return on sales profit from sales. How to diagnose the financial condition of an enterprise? What is the standard value of return on sales?
You will learn:
- What is the return on revenue indicator used for?
- What are the coefficients of financial performance of a company?
- What is the formula to calculate profitability?
- How can profitability be changed and what does it depend on?
- How to calculate profitability indicators using a specific example.
Revenue is the total income received by a company over a certain period. This refers to the total amount before all possible deductions (taxes, variable and fixed expenses of the company).
Determination of profitability of revenue
Net profit is the amount that remains at the company’s disposal after the formation of the wage fund, payment of taxes, fees and other mandatory payments. Profits are used by business entities for reinvestment in further development, expansion of production, increasing the company's working capital, forming reserve funds, etc., that is, improving financial condition and business development.
By calculating the amount of net profit and assessing it over time, we can get an answer to the question: is it worth running such a business further, is the company developing in the right direction, is it financially successful?
Return on revenue is the ratio of profit to revenue. That is, the derived coefficient shows what share profit occupies in the total financial mass of the enterprise’s revenue.
To calculate this indicator, you need to divide profit by revenue and multiply the resulting number by 100%.
The return on revenue formula can be presented as:
Profit/Revenue * 100% = Return on Revenue
Revenue return indicator
The revenue profitability of a particular enterprise is compared with the industry average profitability and potential problems are identified. For example, if the industry average profitability of similar companies at the current time is 15%, and for a specific organization being analyzed is only 3%, then this indicates the presence of incorrect decisions regarding the cost of production or other costs. If costs are too high, the level of profitability of revenue will systematically decrease. Analyzing this indicator, we can draw a conclusion about the literacy and competence of the enterprise management.
The ratio of profit to revenue most fully shows the degree of efficiency in the use of various company resources, including material, monetary, labor, production, etc. Profitability, based on the reason for the analysis, can be calculated as the ratio of net profit to revenue, or as the ratio of profit from sales to revenue, or as a ratio of gross profit to revenue, etc.
How to increase company revenue by 23% in 5 steps
Find out from the article in the electronic magazine “Commercial Director” the experience of a real company that increased its revenue using an algorithm of five simple steps.
Coefficients of financial indicators of enterprise activity
Financial indicators can be either absolute or relative.
Absolute indicators include:
- EBIT is the company's operating profit.
- EBITDA is the company’s profit before taxes, as well as interest and depreciation. EBITDA is used to compare with peers in its industry and determine the effectiveness of business activities, regardless of the presence of debt to the government, creditors and depreciation.
- Operating Cash Flow (OpCF) - refers to the actual amount of free cash remaining at the organization's disposal before paying interest.
- Net (free) cash flow (FCF) - indicates the real amount of free funds that remain at disposal after all payments, with the exception of interest payments and repayment of debts to creditors.
Relative financial indicators characterize the profitability of a business. The higher the profitability, the better the company is able to deal with costs (gross, operating, financial and others) and the higher its profit per unit of cost. They break down profitability into types to increase visibility of which type of costs predominates in the overall structure.
Relative indicators are:
- Gross profitability (margin) is the ratio of gross profit to revenue.
- Operating profitability (margin) is the ratio of operating profit to revenue.
- EBITDA is the ratio of earnings before interest, taxes, depreciation and amortization to revenue.
- Net profit margin is the ratio of net profit to revenue.
- Return on invested capital – characterizes the profitability of an organization when investing using its own and borrowed funds.
- Return on capital ROCE is the ratio of the result before interest expenses and the arithmetic average of the capital employed.
- Earnings per share is the ratio of net profit minus the cost of paying dividends on preferred shares to the total number of ordinary shares.
- ROE - The ratio of net profit to the book value of share capital, shows the efficiency of using the money invested in the issuer's shares.
- ROA – The ratio of net profit to the book value of assets, this relative ratio shows the profitability of assets and reflects the efficiency of the enterprise's use of accumulated resources.
- The dividend payout ratio is the percentage of net profit paid out as dividends.
- The ratio of a company's liabilities to the book value of its share capital. A high value of this ratio, that is, exceeding 100%, indicates the weak financial stability of the company.
- WACC - weighted average cost of capital shows at what interest rate the company's income is capitalized.
The company's profitability, in contrast to profit, which shows the effect of commercial activities, characterizes the effectiveness of these activities. Profitability is a relative indicator that reflects the degree of profitability of an enterprise.
Formula for calculating profitability
Let's look at the calculation using the example of return on sales. The calculation formula in the financial statements will look like:
Return on sales ratio = Net profit / Revenue = line 2400 / line 2110
When calculating the profitability indicator in the formula, instead of net profit, you can put profit before tax, EBITDA, gross profit, operating profit, etc.
In foreign sources, the return on sales ratio - ROS is calculated using the following formula:
The standard value for this indicator is greater than 0. If the return on sales is less than zero, this is direct evidence of ineffective enterprise management.
- construction – 7%;
- wholesale and retail trade – 8%
- mining - 26%;
- agriculture – 11%.
Ways to increase efficiency can be different, including expanding the customer base, increasing product turnover, reducing the cost of goods and services from subcontractors, and taking measures to change the cost of finished goods.
How to change your return on revenue
The measures described below can be used to increase profitability.
Revenue growth outpaces cost growth
This can be achieved either by increasing sales volumes or by changing the product range. With an increase in the number of products sold in physical terms, revenue increases faster than costs. Cost includes variable and fixed costs; changing the cost structure will also change the amount of profit received.
Example of calculating profitability of revenue
For example, let’s look at the reporting of the Rosneft company for 2016; such information is publicly available to all network users. Of all the data required for calculation, only the company's balance sheet for the year and a statement of financial performance are required.
For a complete analysis and comparison with other companies in the industry, as a rule, 3 profitability indicators are calculated:
ROA (return on assets)
To calculate ROA, the total value of assets will be required; it is indicated in the enterprise’s balance sheet, the line “Total assets” is 11,030 billion rubles. From the income statement, you should take the value of net profit in the corresponding line - 201 billion rubles.
The formula for calculating return on assets is the ratio of net profit of 201 billion rubles to the company’s assets of 11,030 billion rubles, multiplied by 100%, that is, equal to 1.8%. Traditionally, ROA is the smallest value of the described indicators.
ROE (return on equity)
To calculate ROE, it is necessary to obtain the amount of the enterprise's equity capital; it is indicated in the balance sheet line - 3,726 billion rubles. But it can also be calculated as the difference in assets of 11,030 billion rubles. and the amount of short-term liabilities (to be paid in the next 12 months) RUB 2,773 billion. and long-term liabilities (which must be paid within a period of more than 12 months) 4,531 billion rubles, that is, a total of 7,304 billion rubles. It turns out that the value of equity capital is 3,726 billion rubles.
Thus, we get an ROE of 5.39%. This is slightly higher than ROA, since usually a company, in addition to its own capital, also attracts borrowed capital.
ROS (return on sales)
To calculate the profitability of sales, you should take the value of net profit from the income statement of 201 billion rubles. and the value of revenue from a similar report is 4,887 billion rubles. Next, we should divide the value of net profit of 201 billion rubles. for a revenue value of RUB 4,887 billion. and multiply by 100%. It turns out that ROS - return on sales - is equal to 4.11%.
Based on this detailed calculation example, you can independently calculate the profitability indicators of any company and compare the resulting ratios with industry averages. As a rule, they are freely available on the Internet for the current year.
Typically, the calculation of profitability of revenue is carried out over several periods, and not just for the last year. The key importance is to compare the obtained indicators with similar data from other enterprises engaged in the same business sector. Return on revenue shows the overall feasibility of business development in this direction, investments for investors and
Hello! Today we’ll talk about profitability, what it is and how to calculate it. aimed at making a profit. The correct operation and effectiveness of the management methods used can be assessed using certain parameters. One of the most optimal and informative is the profitability of the enterprise. For any entrepreneur, understanding this economic indicator is an opportunity to assess the correctness of resource consumption in the enterprise and adjust further actions in all directions.
Why calculate profitability
In many cases, the financial profitability of an enterprise becomes a key indicator for analyzing the activities of a business project, which helps to understand how well the funds invested in it pay off. Correctly calculated indicators for several factors and items are used by the entrepreneur for pricing services or goods, for general analysis at the working stage. They are calculated as a percentage or used in the form of a numerical coefficient: the larger the number, the higher the profitability of the enterprise.
In addition, it is necessary to calculate enterprise profitability ratios in the following production situations:
- To forecast the possible profit that the company can receive in the next period;
- For comparative analysis with competitors in the market;
- To justify large investment investments, helping a potential transaction participant determine the projected return on a future project;
- When determining the real market value of a company during pre-sale preparation.
Calculation of indicators is often used when lending, obtaining loans or participating in joint projects, developing new types of products.
Enterprise profitability
Discarding scientific terminology, we can define the concept:
Enterprise profitability as one of the main economic indicators that well characterizes the profitability of an entrepreneur’s labor. Its calculation will help you understand how profitable the chosen project or direction is.
Many resources are used in the production or sales process:
- Labor (hired workers, personnel);
- Economic;
- Financial;
- Natural.
Their rational and correct operation should bring profit and constant income. For many enterprises, analysis of profitability indicators can become an assessment of operating efficiency for a certain (control) period of time.
In simple words, business profitability is the ratio between the costs of the production process and the resulting profit. If after a period (quarter or year) a business project has produced a profit, then it is called profitable and beneficial for the owner.

To carry out correct calculations and predict indicators in future activities, it is necessary to know and understand the factors that influence profitability to varying degrees. Experts divide them into exogenous and endogenous.
Among exogenous ones there are:
- Tax policy in the state;
- General sales market conditions;
- Geographical location of the enterprise;
- Level of competition in the market;
- Features of the political situation in the country.
In many situations, the profitability and profitability of an enterprise is influenced by its geographic location, proximity to sources of raw materials or consumer clients. The situation on the stock market and exchange rate fluctuations have a huge impact.
Endogenous or internal production factors that greatly influence profitability:
- Good working conditions for personnel of any level (which necessarily has a positive effect on product quality);
- Efficiency of the company's logistics and marketing policy;
- General financial and management policies of management.
Taking into account such subtleties helps an experienced economist make the level of profitability as accurate and realistic as possible.
Factor analysis of enterprise profitability
To determine the degree of influence of any factors on the level of profitability of the entire project, economists conduct special factor analysis. It helps to determine the exact amount of income received under the influence of internal factors, and is expressed by simple formulas:
Profitability = (Profit from sales of products / Cost of production) * 100%
Profitability = ((Product price - Product cost) / Product cost)) * 100%
Typically, when conducting such financial analysis, a three-factor or five-factor model is used. Quantity refers to the number of factors used in the counting process:
- For the three-factor factor, the profitability of manufactured products, the indicator of capital intensity and turnover of fixed assets are taken;
- For the five-factor it is necessary to take into account labor and material intensity, depreciation, and turnover of all types of capital.
Factor calculation is based on the division of all formulas and indicators into quantitative and qualitative, which help to study the development of the company from different angles. It shows a certain relationship: the higher the profit and capital productivity from the production assets of an enterprise, the higher its profitability. It shows the manager the relationship between standards and business results.
Types of profitability
In various production areas or types of business, specific indicators of enterprise profitability are used. Economists identify three significant groups that are used almost everywhere:
- Profitability of products or services: the basis is the ratio of the net profit received from the project (or direction in production) and the costs spent on it. It can be calculated both for the whole enterprise and for one specific product;
- Profitability of the entire enterprise: this group includes many indicators that help characterize the entire enterprise as a whole. It is used to analyze a working project by potential investors or owners;
- Return on assets: a fairly large group of various indicators that show the entrepreneur the feasibility and completeness of using a certain resource. They allow you to determine the rationality of using loans, your own financial investments or other important assets.
Analysis of the profitability of an enterprise should be carried out not only for internal needs: this is an important stage before large investment projects. It may be requested when providing a loan, or it may become the starting point for enlarging or reducing production.

A real complete picture of the state of affairs at the enterprise can be obtained by calculating and analyzing several indicators. This will allow you to see the situation from different angles and understand the reason for the decrease (or increase) in expenses for any items. To do this, you may need several coefficients, each of which will reflect a specific resource:
- ROA – return on assets;
- ROM – level of product profitability;
- ROS – return on sales;
- ROFA – return on fixed assets;
- ROL – personnel profitability;
- ROIC – return on investment in an enterprise;
- ROE – return on equity.
These are just a small number of the most common odds. To calculate them, it is enough to have figures from open sources - the balance sheet and its annexes, current sales reports. If an estimated assessment of the profitability of a business for launch is needed, the data is taken from a marketing analysis of the market for similar products or services, from competitors’ reports available in a general overview.
Calculation of enterprise profitability
The largest and most general indicator is the level of profitability of the enterprise. To calculate it, only accounting and statistical documentation for a certain period is used. In a more simplified version, the formula for enterprise profitability looks like this:
P= BP/SA*100%
- P is the main profitability of the enterprise;
- BP is an indicator of balance sheet profit. It is equal to the difference between revenue received and cost (including organizational and management costs), but before taxes are subtracted;
- CA is the total cost of all current and non-current assets, production facilities and resources. It is taken from the balance sheet and its annexes.
For the calculation, you will need the average annual cost of all tangible assets, the depreciation of which is used in the formation of the selling price for services or goods.
If the assessment of the profitability of the enterprise is low, then certain management measures should be taken to improve the situation. It may be necessary to adjust production costs, reconsider management methods or rationalize the use of resources.
How to calculate return on assets
A complete analysis of an enterprise's profitability indicators is impossible without calculating the efficiency of using various assets. This is the next important stage, which helps to assess how fully all assets are used and understand their impact on profit. When assessing this indicator, pay attention to its level. A low value indicates that capital and other assets are not performing sufficiently, while a high value confirms the correct management tactics.
In practice, the return on assets (ROA) indicator for an economist means the amount of money that falls on one unit of assets. In simple words, it shows the financial return of a business project. Calculation for all types of assets must be carried out regularly. This will help in a timely manner to identify an object that does not bring return or benefit in order to sell it, lease it or modernize it.
In economic sources, the formula for calculating return on assets looks like:
- P – profit for the entire analyzed period;
- A is the average value by type of asset for the same time.
This coefficient is one of the three most revealing and informative for a manager. A value less than zero indicates that the enterprise is operating at a loss.
Return on fixed assets

When calculating assets, the profitability ratio of fixed assets is separately identified. These include various means of labor that are directly or indirectly involved in the production process without changing the original form. The period of their use must exceed a year, and the amount of depreciation is included in the cost of services or products. Such basic means include:
- Any buildings and structures in which workshops, offices, laboratories or warehouses are located;
- Equipment;
- Heavy duty vehicles and loaders;
- Office and work furniture;
- Passenger cars and passenger transport;
- Expensive tool.
Calculating the profitability of fixed assets will show managers how effective the economic activity of a business project is and is determined by the formula:
R = (PR/OS) * 100%
- PE – net profit for a certain period;
- OS – cost of fixed assets.
This economic indicator is very important for commercial manufacturing enterprises. It gives an idea of the share of profit that falls on one ruble of invested fixed assets.
The coefficient directly depends on profitability and should not be less than zero: this means that the company is operating at losses and is using its fixed assets irrationally.
Profitability of products sold
This indicator is no less important for determining the level of profitability and success of the company. In international economic practice, it is designated as ROM and is calculated using the formula:
ROM=Net profit/cost
The resulting coefficient helps determine the efficiency of sales of manufactured products. In fact, this is the ratio of sales income and costs of its production, packaging and sale. For an economist, the indicator clearly demonstrates how much each ruble spent will bring in percentage terms.
The algorithm for calculating the profitability of products sold may be more understandable for beginners:
- The period in which it is necessary to analyze the indicator is determined (from a month to a whole year);
- The total amount of profit from sales is calculated by adding up all income from the sale of services, products or goods;
- Net profit is determined (according to the balance sheet);
- The indicator is calculated using the above formula.
A good analysis will include a comparison of profitability of products sold over several periods. This will help determine the decline or increase in the company’s income over time. In any case, you can conduct a more in-depth review of each supplier, group of products or assortment, and work through the customer base.
Return on sales
Margin or return on sales is another important consideration when pricing a product or service. It shows what percentage of total revenue comes from the profit of the enterprise.
There is a formula that helps calculate this type of indicator:
ROS= (Profit / Revenue) x 100%
As a basis for calculation, different types of profit can be used. Values are specific and vary depending on the product range, company activity and other factors.
Sometimes experts call return on sales the rate of profitability. This is due to the ability to show the share of profit in total sales revenue. It is also calculated over time to track changes over several periods.
In the short term, a more interesting picture can be given by operating profitability of sales, which can be easily calculated using the formula:
Operating return on sales = (Profit before tax / Revenue) x 100%
All indicators for calculations in this formula are taken from the “Profit and Loss Statement”, which is attached to the balance sheet. The new indicator helps the entrepreneur understand what real share of revenue is contained in each monetary unit of his revenue after paying all taxes and fees.
Such indicators can be calculated for a small enterprise, one department or an entire industry, depending on the task at hand. The higher the value of this economic coefficient, the better the enterprise performs and the more profit its owner receives.

This is one of the most informative indicators that helps determine how profitable a business project is. Without calculating it, it is impossible to draw up a business plan, track costs over time, or assess the profitability of the enterprise as a whole. It can be calculated using the formula:
R=VP/V, Where:
- VP – gross profit (calculated as the difference between the revenue received from the sale of goods or services and the cost);
- B – proceeds from the sale.
The formula often uses a net profit indicator, which better reflects the state of affairs at the enterprise. The amount can be taken from the balance sheet appendix.
Net profit no longer includes income tax, various selling and overhead expenses. It includes current operating costs, various penalties and paid loans. To determine it, the total revenue that was received from the sale of services or goods (including discounts) is calculated. All expenses of the enterprise are deducted from it.
It is necessary to carefully select the time period depending on the task of financial analysis. To determine the results of internal control, the calculation of profitability is carried out over time regularly (monthly or quarterly). If the goal is to obtain an investment or loan, a longer period is taken for comparison.
Obtaining the profitability ratio provides a lot of information for the management personnel of the enterprise:
- Shows the correspondence between actual and planned results, helps evaluate business performance;
- Allows you to conduct a comparative analysis with the results of other competing companies in the market.
If the indicator is low, the entrepreneur needs to think about improving it. This can be achieved by increasing the amount of revenue received. An alternative is to increase sales, raise prices slightly, or optimize costs. You should start with small innovations, observing the dynamics of changes in the coefficient.
Personnel profitability
One interesting relative indicator is personnel profitability. Almost all enterprises, regardless of their form of ownership, have long taken into account the importance of effective labor management. They influence all areas of production. To do this, it is necessary to monitor the number of personnel, their level of training and skill, and improve the qualifications of individual employees.
The profitability of personnel can be determined using the formula:
- PE – net profit of the enterprise for a certain period of time;
- CH – number of employees at different levels.
In addition to this formula, experienced economists use more informative ones:
- Calculate the ratio of all personnel costs to net profit;
- The personal profitability of one employee, which is determined by dividing the costs associated with him by the share of profit brought to the enterprise budget.
Such a complete and detailed calculation will help determine labor productivity. Based on it, you can carry out a kind of diagnostics of jobs that may be reduced or need to be expanded.
Do not forget that the profitability of personnel may be affected by low-quality or old equipment, its downtime or other factors. This can reduce performance and incur additional costs.
One of the unpleasant, but sometimes necessary methods is often reducing the number of employees. Economists must calculate the profitability for each type of personnel in order to highlight the weakest and most vulnerable areas.
For small enterprises, regular calculation of this coefficient is necessary in order to adjust and optimize their expenses. With a small team, it is easier to carry out calculations, so the result can be more complete and accurate.
Profitability threshold
For many trading and manufacturing enterprises, calculating the profitability threshold is of great importance. It means the minimum volume of sales (or sales of finished products), at which the revenue received will cover all costs of production and delivery to the consumer, but without taking into account profit. In fact, the profitability threshold helps the entrepreneur determine the number of sales at which the enterprise will operate without losses (but will not make a profit).
In many economic sources, this important indicator can be found under the name “break-even point” or “critical point”. It means that the enterprise will receive income only if it overcomes this threshold and increases the coefficient. It is necessary to sell goods in quantities that exceed the volume obtained according to the formula:
- PR – threshold (norm) of profitability;
- FZ – fixed costs for sales and production;
- Kvm – gross margin coefficient.
The last indicator is pre-calculated using the formula:
Kvm=(V – Zpr)*100%
- B – enterprise revenue;
- Zpr – the sum of all variable costs.
The main factors influencing the profitability threshold ratio:
- Product price per unit;
- Variable and fixed costs at all stages of production and sale of this product (service).
With the slightest fluctuation in the values of these economic factors, the value of the indicator also changes up or down. Of particular importance is the analysis of all expenses, which economists divide into fixed and variable. The first include:
- Depreciation for fixed assets and equipment;
- Rent;
- All utility costs and payments;
- Salaries of enterprise management employees;
- Administrative costs for their maintenance.
They are easier to analyze and control, and can be monitored over time. Variable costs become more “unpredictable”:
- Wages of the entire workforce of the enterprise;
- Fees for servicing accounts, loans or transfers;
- Costs for the purchase of raw materials and components (especially when exchange rates fluctuate);
- Payment for energy resources spent on production;
- Transport costs.
If a company wants to remain consistently profitable, its management must control the rate of profitability and analyze expenses for all items.

Any enterprise strives to develop and increase capacity, open new areas of activity. Investment projects also require detailed analysis, which helps determine their effectiveness and adjust investments. In domestic practice, several basic calculation methods are more often used, giving an idea of what the profitability of a project is:
- Methodology for calculating net present value: it helps determine the net profit from a new project;
- Methodology for calculating the profitability index: necessary to generate income per unit of cost;
- Method for calculating marginal efficiency of capital (internal rate of return). It is used to determine the maximum possible level of capital expenditure for a new project. The internal rate of return is most often calculated using the formula:
INR = (current net worth / current initial investment amount) * 100%
Most often, such calculations are used by economists for certain purposes:
- If necessary, determine the level of expenses in the case of developing a project using raised funds, loans or credits;
- To prove cost-effectiveness and document the benefits of the project.
If there are bank loans, calculating the internal rate of return will give the maximum allowable interest rate. Exceeding it in real work will mean that the new enterprise or direction will be unprofitable.
- Methodology for calculating the return on investment;
- A more accurate modified method for calculating the internal rate of return, for the calculation of which the weighted average cost of the advanced capital or investment is taken;
- An accounting rate of return technique that is used for short-term projects. In this case, profitability will be calculated using the formula:
RP=(PE + depreciation/amount of investment in the project) * 100%
PE – net profit from a new business project.
A full calculation in various ways is done not only before developing a business plan, but also during the operation of the facility. This is a necessary set of formulas that owners and potential investors use when trying to assess the possible benefits.
Ways to increase enterprise profitability
Sometimes the analysis produces results that require serious management decisions. To determine how to increase profitability, it is necessary to understand the reasons for its fluctuations. To do this, the indicator for the reporting and previous periods is studied. Typically, the base year is the past year or quarter, in which there was high and stable revenue. What follows is a comparison of the two coefficients over time.
The profitability indicator may be affected by changes in selling prices or production costs, increases in costs or the cost of raw materials from suppliers. Therefore, it is necessary to pay attention to factors such as seasonal fluctuations in the demand of product buyers, activity, breakdowns or downtime. When solving the problem of how to increase profitability and profitability, it is necessary to use various ways to increase profits:
- Improve the quality of products or services and their packaging. This can be achieved by modernizing and re-equipping its production facilities. This may require serious investment at first, but in the future it will more than pay off in resource savings, a reduction in the amount of raw materials, or a more affordable price for the consumer. You can consider the option;
- Improve the properties of your products, which will help attract new consumers and become a more competitive company in the market;
- Develop a new active marketing policy for your business project and attract good management personnel. Large enterprises often have an entire marketing department that deals with market analysis, new promotions, and finding a profitable niche;
- Various ways to reduce costs in order to compete with a similar range. This should not come at the expense of the quality of the product!
The manager needs to find a certain balance among all the methods in order to achieve a lasting positive result and maintain the enterprise’s profitability indicators at the proper level.
Performance indicators can be divided into direct and inverse. Direct efficiency indicators are return coefficients, which show what conventional unit of result is obtained from a conventional unit of costs for its production. Inverse efficiency indicators are capacity coefficients, which illustrate how many conventional units of input are needed to obtain a conventional unit of result.
One of the main indicators of the efficiency of an enterprise's economic activity is profitability. Profitability indicators are less susceptible to the influence of inflation and are expressed by different ratios of profit and costs. Profitability indicators are mainly measured in the form of ratios.
Profitability
Profitability can be defined as an indicator of economic efficiency, reflecting the degree of efficiency in the use of material, monetary, production, labor and other resources.
Profitability indicators are divided into different groups and calculated as the ratio of selected indicators.
The main types of profitability are the following indicators:
- Return on assets.
- Profitability of fixed production assets.
- Sales profitability.
Return on assets
Return on assets is a financial ratio showing the profitability and efficiency of an enterprise. Return on assets shows how much profit an organization receives from each ruble spent. Return on assets is calculated as the quotient of net profit divided by average assets, multiplied by 100%.
Return on assets = (Net profit / Average annual assets) x 100%
The values for calculating return on assets can be taken from the financial statements. Net profit is indicated in Form No. 2 “Profit and Loss Statement” (new name “Statement of Financial Results”), and the average value of assets can be obtained from Form No. 1 “Balance Sheet”. For accurate calculations, the arithmetic average of assets is calculated as the sum of assets at the beginning of the year and the end of the year, divided by two.
Using the return on assets indicator, you can identify the discrepancies between the predicted level of profitability and the actual indicator, and also understand what factors influenced the deviations.
Return on assets can be used to compare the performance of companies in the same industry.
For example, the value of the enterprise’s assets in 2011 amounted to 2,698,000 rubles, in 2012 – 3,986,000 rubles. Net profit for 2012 is 1,983,000 rubles.
The average annual value of assets is equal to 3,342,000 rubles (arithmetic average between the indicators of the value of assets for 2011 and 2012)
Return on assets in 2012 was 49.7%.
Analyzing the obtained indicator, we can conclude that for each ruble spent the organization received a profit of 49.7%. Thus, the profitability of the enterprise is 49.7%.
Profitability of fixed production assets
Profitability of fixed production assets or profitability of fixed assets is the quotient of net profit divided by the cost of fixed assets, multiplied by 100%.
Profitability of general fund = (Net profit / Average annual cost of fixed assets) x 100%
The indicator shows the real profitability from the use of fixed assets in the production process. Indicators for calculating the profitability of fixed production assets are taken from financial statements. Net profit is indicated in Form No. 2 “Profit and Loss Statement” (new name “Statement of Financial Results”), and the average value of fixed assets can be obtained from Form No. 1 “Balance Sheet”.
For example, the value of the enterprise's fixed production assets in 2011 amounted to 1,056,000 rubles, in 2012 – 1,632,000 rubles. Net profit for 2012 is 1,983,000 rubles.
The average annual cost of fixed assets is equal to 1,344,000 rubles (arithmetic average of the cost of fixed assets for 2011 and 2012)
The profitability of fixed production assets is 147.5%.
Thus, the real return on the use of fixed assets in 2012 was 147.5%.
Return on sales
Return on sales shows what portion of an organization's revenue is profit. In other words, return on sales is a coefficient that illustrates what share of profit is contained in each ruble earned. Return on sales is calculated for a given period of time and expressed as a percentage. With the help of sales profitability, an enterprise can optimize costs associated with commercial activities.
Return on Sales = (Profit / Revenue) x 100%
Return on sales values are specific to each organization, which can be explained by differences in the competitive strategies of companies and their product range.
To calculate return on sales, different types of profit can be used, which leads to the existence of different variations of this ratio. The most commonly used are return on sales calculated based on gross profit, operating return on sales, and return on sales calculated based on net profit.
Return on sales by gross profit = (Gross profit / Revenue) x 100%
Return on sales based on gross profit is calculated as the quotient obtained by dividing gross profit by revenue multiplied by 100%.
Gross profit is determined by subtracting cost of sales from revenue. These indicators are contained in Form No. 2 “Profit and Loss Statement” (new name “Statement of Financial Results”).
For example, the gross profit of the enterprise in 2012 was 2,112,000 rubles. Revenue in 2012 was 4,019,000 rubles.
The gross profit margin on sales is 52.6%.
Thus, we can conclude that each ruble earned contains 52.6% of the gross profit.
Operating return on sales = (Profit before tax / Revenue) x 100%
Operating return on sales is the ratio of profit before taxes to revenue, expressed as a percentage.
Indicators for calculating operating profitability are also taken from Form No. 2 “Profit and Loss Statement”.
Operating return on sales shows what part of the profit is contained in each ruble of revenue received minus interest and taxes paid.
For example, profit before tax in 2012 is 2,001,000 rubles. Revenue in the same period amounted to 4,019,000 rubles.
Operating return on sales is 49.8%.
This means that after deducting taxes and interest paid, each ruble of proceeds contains 49.8% of profit.
Return on sales by net profit = (Net profit / Revenue) x 100%
Return on sales based on net profit is calculated as the quotient of net profit divided by revenue, multiplied by 100%.
Indicators for calculating return on sales based on net profit are contained in Form No. 2 “Profit and Loss Statement” (new name “Financial Results Statement”).
For example, Net profit in 2012 is equal to 1,983,000 rubles. Revenue in the same period amounted to 4,019,000 rubles.
Return on sales based on net profit is 49.3%. This means that in the end, after paying all taxes and interest, 49.3% of profit remained in each ruble earned.
Cost-benefit analysis
Return on sales is sometimes called the rate of profitability, because return on sales shows the share of profit in the proceeds from the sale of goods, works, and services.
To analyze the coefficient characterizing the profitability of sales, you need to understand that if the profitability of sales decreases, this indicates a decrease in the competitiveness of the product and a drop in demand for it. In this case, the enterprise should think about carrying out activities to stimulate demand, improving the quality of the product offered, or conquering a new market niche.
Within the framework of factor analysis of profitability of sales, the influence of profitability on changes in prices for goods, works, services and changes in their costs is considered.
To identify trends in changes in sales profitability over time, you need to distinguish the base and reporting periods. As a base period, you can use the indicators of the previous year or the period in which the company made the greatest profit. The base period is needed to compare the obtained return on sales ratio for the reporting period with the ratio taken as a basis.
Sales profitability can be increased by increasing prices for the range offered or reducing costs. To make the right decision, an organization must focus on such factors as: the dynamics of market conditions, fluctuations in consumer demand, the possibility of saving internal resources, assessing the activities of competitors, and others. For these purposes, tools of product, pricing, sales and communication policies are used.
The following main directions for increasing profits can be identified:
- Increase in production capacity.
- Product quality management.
- Development of marketing policy.
- Cost reduction.
- Staff motivation.
Using the achievements of scientific progress requires capital investment, but allows you to reduce the costs of the production process. Existing equipment can be upgraded, which will lead to resource savings and increased operational efficiency.
High-quality products are always in demand, therefore, if the level of return on sales is insufficient, the company should take measures to improve the quality of the products offered.
Marketing strategies are focused on product promotion based on market research and consumer preferences. Large companies create entire marketing departments. Some enterprises have a separate specialist who is involved in the development and implementation of marketing activities. In small organizations, the responsibilities of a marketer are assigned to managers and other specialists in management departments. requires significant costs, but its successful implementation leads to excellent financial results.
The cost of the proposed product range can be reduced by finding suppliers who offer products and services cheaper than others. Also, while saving on the price of materials, you need to ensure that the quality of the final product offered for sale remains at the proper level.
Personnel management is a separate sector of management activity. The production of quality products, the reduction of defective products, and the sale of the final product to a certain extent depend on the responsibility of employees. In order for employees to perform their job duties efficiently and promptly, there are various motivational and incentive strategies. For example, bonuses for the best employees, holding corporate events, organizing corporate press, etc.
Summarizing the above, readers of MirSovetov can conclude that profit and profitability indicators are the main criteria for determining the effectiveness of the financial and economic activities of an enterprise. In order to improve the financial result, it is necessary to evaluate it, and based on the information received, analyze which factors are hindering the development of the organization as a whole. Once the existing problems have been identified, you can move on to formulating the main directions and activities in order to increase the company's profits.
They are obtained by dividing the profit from the sale of products by the amount of revenue received. The initial data for its calculation is the balance sheet.
It is calculated in the FinEkAnalysis program in the Profitability Analysis block as Return on Sales.
Return on sales - what it shows
Shows how much profit the company receives from each ruble of products sold.
Return on sales - formula
General formula for calculating the coefficient:
Calculation formula based on the old balance sheet data:
| K rp = | page 050 | *100% |
| p.010 |
Where page 050 And page 010 profit and loss statement (form No. 2).
Calculation formula based on the new balance sheet:
Return on sales - meaning
It is used as the main indicator for assessing the financial performance of companies with relatively small amounts of fixed assets and equity capital. Assessing the profitability of sales makes it possible to objectively look at the state of affairs.
The return on sales indicator characterizes the main aspect of the company's work - the sale of main products.
Return on sales - diagram
1. Increasing the indicator.
a) Revenue growth rates outpace cost growth rates. Possible reasons:
- increase in sales volumes,
- change in sales mix.
With an increase in the number of products sold in physical terms, revenue increases faster than costs as a result of production leverage.
The components of product cost are variable and fixed costs. Changing the cost structure can greatly affect profit margins. Investing in fixed assets is accompanied by an increase in fixed costs and, theoretically, a decrease in variable costs. Moreover, the relationship is nonlinear, so finding the optimal combination of fixed and variable costs is not easy.
In addition to simply raising prices for its products, a company can increase revenue by changing its product mix. This trend in the development of the enterprise is favorable.
b) The rate of cost reduction is faster than the rate of revenue decline. Possible reasons:
- increase in prices for products (works, services),
- change in the assortment structure.
In this case, there is a formal improvement in the profitability indicator, but the volume of revenue decreases; the trend cannot be called unambiguously favorable. To correctly draw conclusions, analyze the pricing policy and assortment policy of the enterprise.
c) Revenue increases, costs decrease. Possible reasons:
- price increase,
- change in sales mix,
- change in cost standards.
This trend is favorable, and further analysis is carried out to assess the sustainability of this position of the company.
2. Decrease in indicator.
a) The growth rate of costs outpaces the growth rate of revenue. Possible reasons:
- inflationary growth in costs outpaces revenues,
- price reduction,
- change in the structure of the sales range,
- increase in cost standards.
This is an unfavorable trend. To correct the situation, they analyze the issues of pricing at the enterprise, assortment policy, and cost control system.
b) The rate of revenue decline is faster than the rate of cost reduction. Possible reasons:
- reduction in sales volumes.
This situation is common when an enterprise reduces its activities in the market. Revenue declines faster than costs as a result of operating leverage. An analysis of the company's marketing policy should be made.
c) Revenue decreases, costs increase. Possible reasons:
- price reduction,
- increase in cost standards,
- changing the structure of the sales range.
An analysis of pricing, cost control systems, and assortment policy is required.
In normal (stable) market conditions, revenue dynamics change faster than costs only under the influence of production leverage. The remaining cases are associated either with changes in the external and internal conditions of the enterprise’s functioning (inflation, competition, demand, cost structure), or with an ineffective system of accounting and control in production.
Was the page helpful?
Synonyms
More found about return on sales
- Analysis of the profitability of the main activities of a trading organization
It characterizes the efficiency of entrepreneurial activity and how much profit an organization has from one ruble of sales. Return on sales is defined as the ratio of profit from sales or net profit to the amount received - Analysis of the current level, features and trends of profitability indicators of Russian joint-stock companies
Cost profitability Product profitability - the ratio of profit from sales to the cost of sales Product profitability shows the profit that the company received per 1 ruble of current costs Let's imagine the percentage - Assessing the influence of factors on profitability indicators
Or if you try the reduction method, divide the numerator and denominator by revenue, then you can use the following factor model: return on sales multiplied by the turnover ratio of current assets Profit from sales multiplied by the turnover ratio - Total return on sales
Total profitability of sales Total profitability of sales - definition Total profitability of sales - coefficient equal to the ratio of book profit - Low profitability threshold and on-site inspections
Profitability indicators can be divided into two groups: return on sales return on assets Return on sales is a profitability ratio that shows the share of profit in each - Analysis of financial assets according to consolidated statements
NROSEBIFA - net return on sales based on earnings before interest and before taking into account income expenses from financial assets - Formation of a scoring model for assessing the creditworthiness of a corporate borrower
EBIT Interest 0.0790 4 > 1.5 4 1.3-1.5 3 1-1.3 2< 1 0 Рентабельность продаж ROS 0,1256 6 > 0,025 6 0,02-0,025 5 0,015-0,02 3 < 0,015 0 - Pre-audit analysis as a tool for predicting on-site tax audits of penal institutions and its improvement
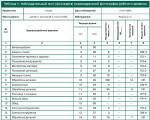
Return on sales % Return on assets % Return on sales % Return on assets % Garment production 7.1 3.5 - Factor analysis of the formation and use of company profits
Profitability of products sold, profitability of sales is calculated using the formula. The reduction in the level of the return on sales ratio is a negative trend. The enterprise does not - Factor analysis of financial results of agricultural producers
The influence of factors on the profitability of sales or the profitability of core activities can be assessed using the method of chain substitutions Substitution Factor rub Product profitability - Features of the financial policy of companies in times of crisis
ROS - net return on sales on earnings before interest kic - turnover ratio of invested capital In the index - Anti-crisis management of financial and economic stability of an industrial enterprise
Reasons for the decrease in profitability of sales: increase in product costs decrease in sales volumes Having determined the reasons for the decrease in profitability of sales, we can name - Key aspects of managing an organization's profit
The following groups of profitability indicators can be distinguished: return on assets with detailing into non-current current and net assets return on capital of total debt return on sales return on expenses When calculating the profitability indicators of XYZ OJSC, balance sheet data for 2013 were used - Forecast balance taking into account current trends, forecast volumes and profitability of sales, changes in non-current assets
FinEkAnalysis you can quickly build a forecast balance sheet taking into account current trends in forecast volumes and profitability of sales changes in non-current assets Example of a report automatically generated by the FinEkAnalysis program Forecast balance sheet taking into account - Analysis of the capital structure and profitability of leading Russian oil and gas enterprises
The profitability of sales and the profitability of the core activities of PJSC Gazprom decreased slightly, but other indicators increased, including - Profitability: To be managed, it must be measured correctly.
Total cost Return on sales Sales revenue Return on assets Fixed assets Working capital Capital Return on equity - Analysis of consolidated and segment reporting: methodological aspect
Net sales revenue 4.5 Return on assets Net profit Average balance sheet currency 4.6 Return on equity Net profit - Financial analysis of small business development in Russia
Among the indicators of profitability of organizations, an important characteristic in the assessment is the profitability of operating activities, return on sales and return on assets. Return on sales is measured by the ratio of profit to sales volume Fig. 7 - Tools for assessing the safety of economic activities of production organizations
NFA → growth in return on net assets is greater than return on sales RFA > RP growth rate in return on net assets is greater than growth rate in profitability and - Analysis of the weighted average cost of invested capital in a value chain analysis system
Operational financial stability Return on sales for net profit 0.12 and above 0.04-0.12 0.04 and below Return on sales for
Globally, profitability is a set of indicators that collectively characterize the efficiency of a business, or rather its profitability. Profitability is always the ratio of profit to the object whose effect you want to know. In fact, this is the share of profit per unit of the analyzed object.
Using profitability indicators, you can find out how effectively the equity capital or assets of the enterprise are used ( see “Determining return on assets (balance sheet formula)” ), whether its production is profitable. But in this article we will focus directly on the profitability of sales.
Return on sales is the ratio of profit to revenue
Return on sales gives an idea of the share of profit in the company's revenue. In analysis, it is usually referred to as ROS (short for return on sales).
The general formula for return on sales is as follows:
ROS = Pr / Op × 100%,
where: ROS - return on sales;
Pr - profit;
Op - sales volume or revenue.
Return on sales is a relative indicator; it is expressed as a percentage.
How to calculate return on sales on balance sheet
To calculate the profitability of sales, information from the financial results report (Form 2) is used.
Read the article about Form 2 “Filling out Form 2 of the balance sheet (sample)” .
In this case, the formula for profitability of sales on the balance sheet depends on what profitability the user is interested in:
- Gross profit margin. In this case, the formula for calculating profitability of sales will be as follows:
ROS = line 2100 / line 2110 × 100.
- Operating profit margin:
ROS = (line 2300 + line 2330) / line 2110 × 100.
- Net profit margin:
ROS = line 2400 / line 2110 × 100.
What is the standard value of return on sales?
There are no special standards for profitability of sales. Average statistical values of profitability by industry are calculated. For each type of activity, its own coefficient is considered normal.
In general, a coefficient ranging from 1 to 5% indicates that the enterprise is low-profitable, from 5 to 20% is medium-profitable, and from 20 to 30% is highly profitable. Over 30% is already super-profitability.